
One way to analyze process improvements is to consider cost reduction techniques through material optimization. A very common way is to reduce your scrap material using a material optimizer. In order to reduce scrap, the discussion typically goes to improving yield. But what is a yield? A yield is a number, often a percentage, which indicates utilization of your raw material. This can be very good information, but it is not the correct metric to use for comparison unless you are very careful to consider all the small tricks companies use to try to inflate their yield values.
Conventional wisdom tells us that the higher the yield, the more production you will get from your raw material. This means less material scrap. However, this can be abused and yield numbers can be artificially inflated unless you are careful. This number only makes sense with your current situation; it is not something that can be compared unless you normalize all your data.
To challenge this idea, consider this real-world example.
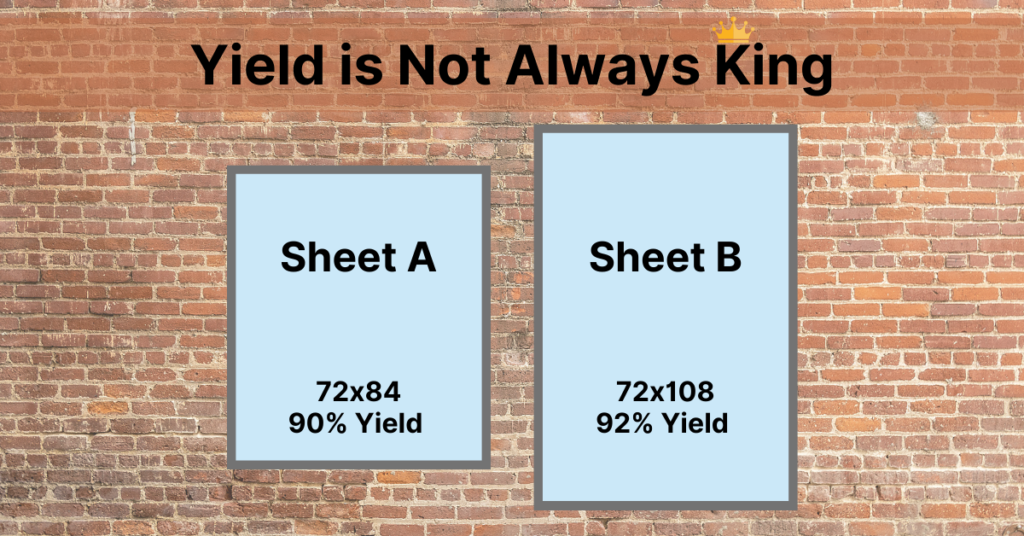
Suppose you have two glass sheets, sheet A is 72×84 (6048 sq. in.) and sheet B is 72×108 (7776 sq. in.). Now, suppose you have a 90% yield with sheet A and a 92% yield with sheet B? You might look at this and think sheet B has better cost optimization because of the high yield. However, when you do the math, you can see that sheet A had 605 sq. in. of scrap, and sheet B had 622 sq. in. of scrap. Even though sheet B had a high yield, there was still more scrap and thus more wasted dollars. And even though there is more production done with sheet B, this just represents a small moment in time. Typically there are dozens, or maybe even hundreds of sheets used in a single day.
So, how do you compare optimization results?
It’s a complicated topic as there are many things to consider other than high yield. But, for argument’s sake, when comparing yields, it always comes down to normalize the data in a way that can be comparable.
You need to analyze the entire situation and get rid of the idea of all the things that interfere with the calculation (different stock sizes, trims, filler, etc.) This allows for one common baseline calculation. The more data available, the better decision that can be made. This might be production data that has been collected for many days, weeks, or even months.
After collecting data, optimize this data through the material optimizers you want to compare. Calculate the total production material used, and nothing more. Next calculate the total amount of raw material the optimizer used, which must include scrap, kerf, trim, last sheet/bar, etc. Even though that material cannot be optimized, you are still paying for it so it must be counted.
Once you have these values, you simply take total production and divide it by the total amount of raw material. You have now removed all the minutiae that companies use to try to inflate their yield numbers. Finally, a normalized yield calculation that can be compared with other optimizations has resulted.
Interested in learning more about material optimization? Check out our blog post on how optimization can help!